AI Visualization
WEB / DATA DESIGN
SENIOR DESIGNER
Abstract
The purpose of this project was to create an analytics tool that would give data scientists visualization of the quality of their ML models. It would also help to democratize artificial intelligence to the rest of the company, either to be used for other projects or to act as a feedback loop to help improve AI signal accuracy.
Role & Objectives
- Lead designer, sole designer and researcher responsible for creating a visualization tool for ML signal data sets for videos
- Conducted research sessions with data scientists to evaluate their workflows, uncover unmet needs, and understand the terminology and solutions they use to analyze their models and create confidence ratings.
- The complexity of the tool required me to draw diagrams that mapped out the information architecture and the objects and actions of each part of the tool.
Video Details Diagram
A hybrid diagram showing both information architecture and object-action modeling of a video details screen
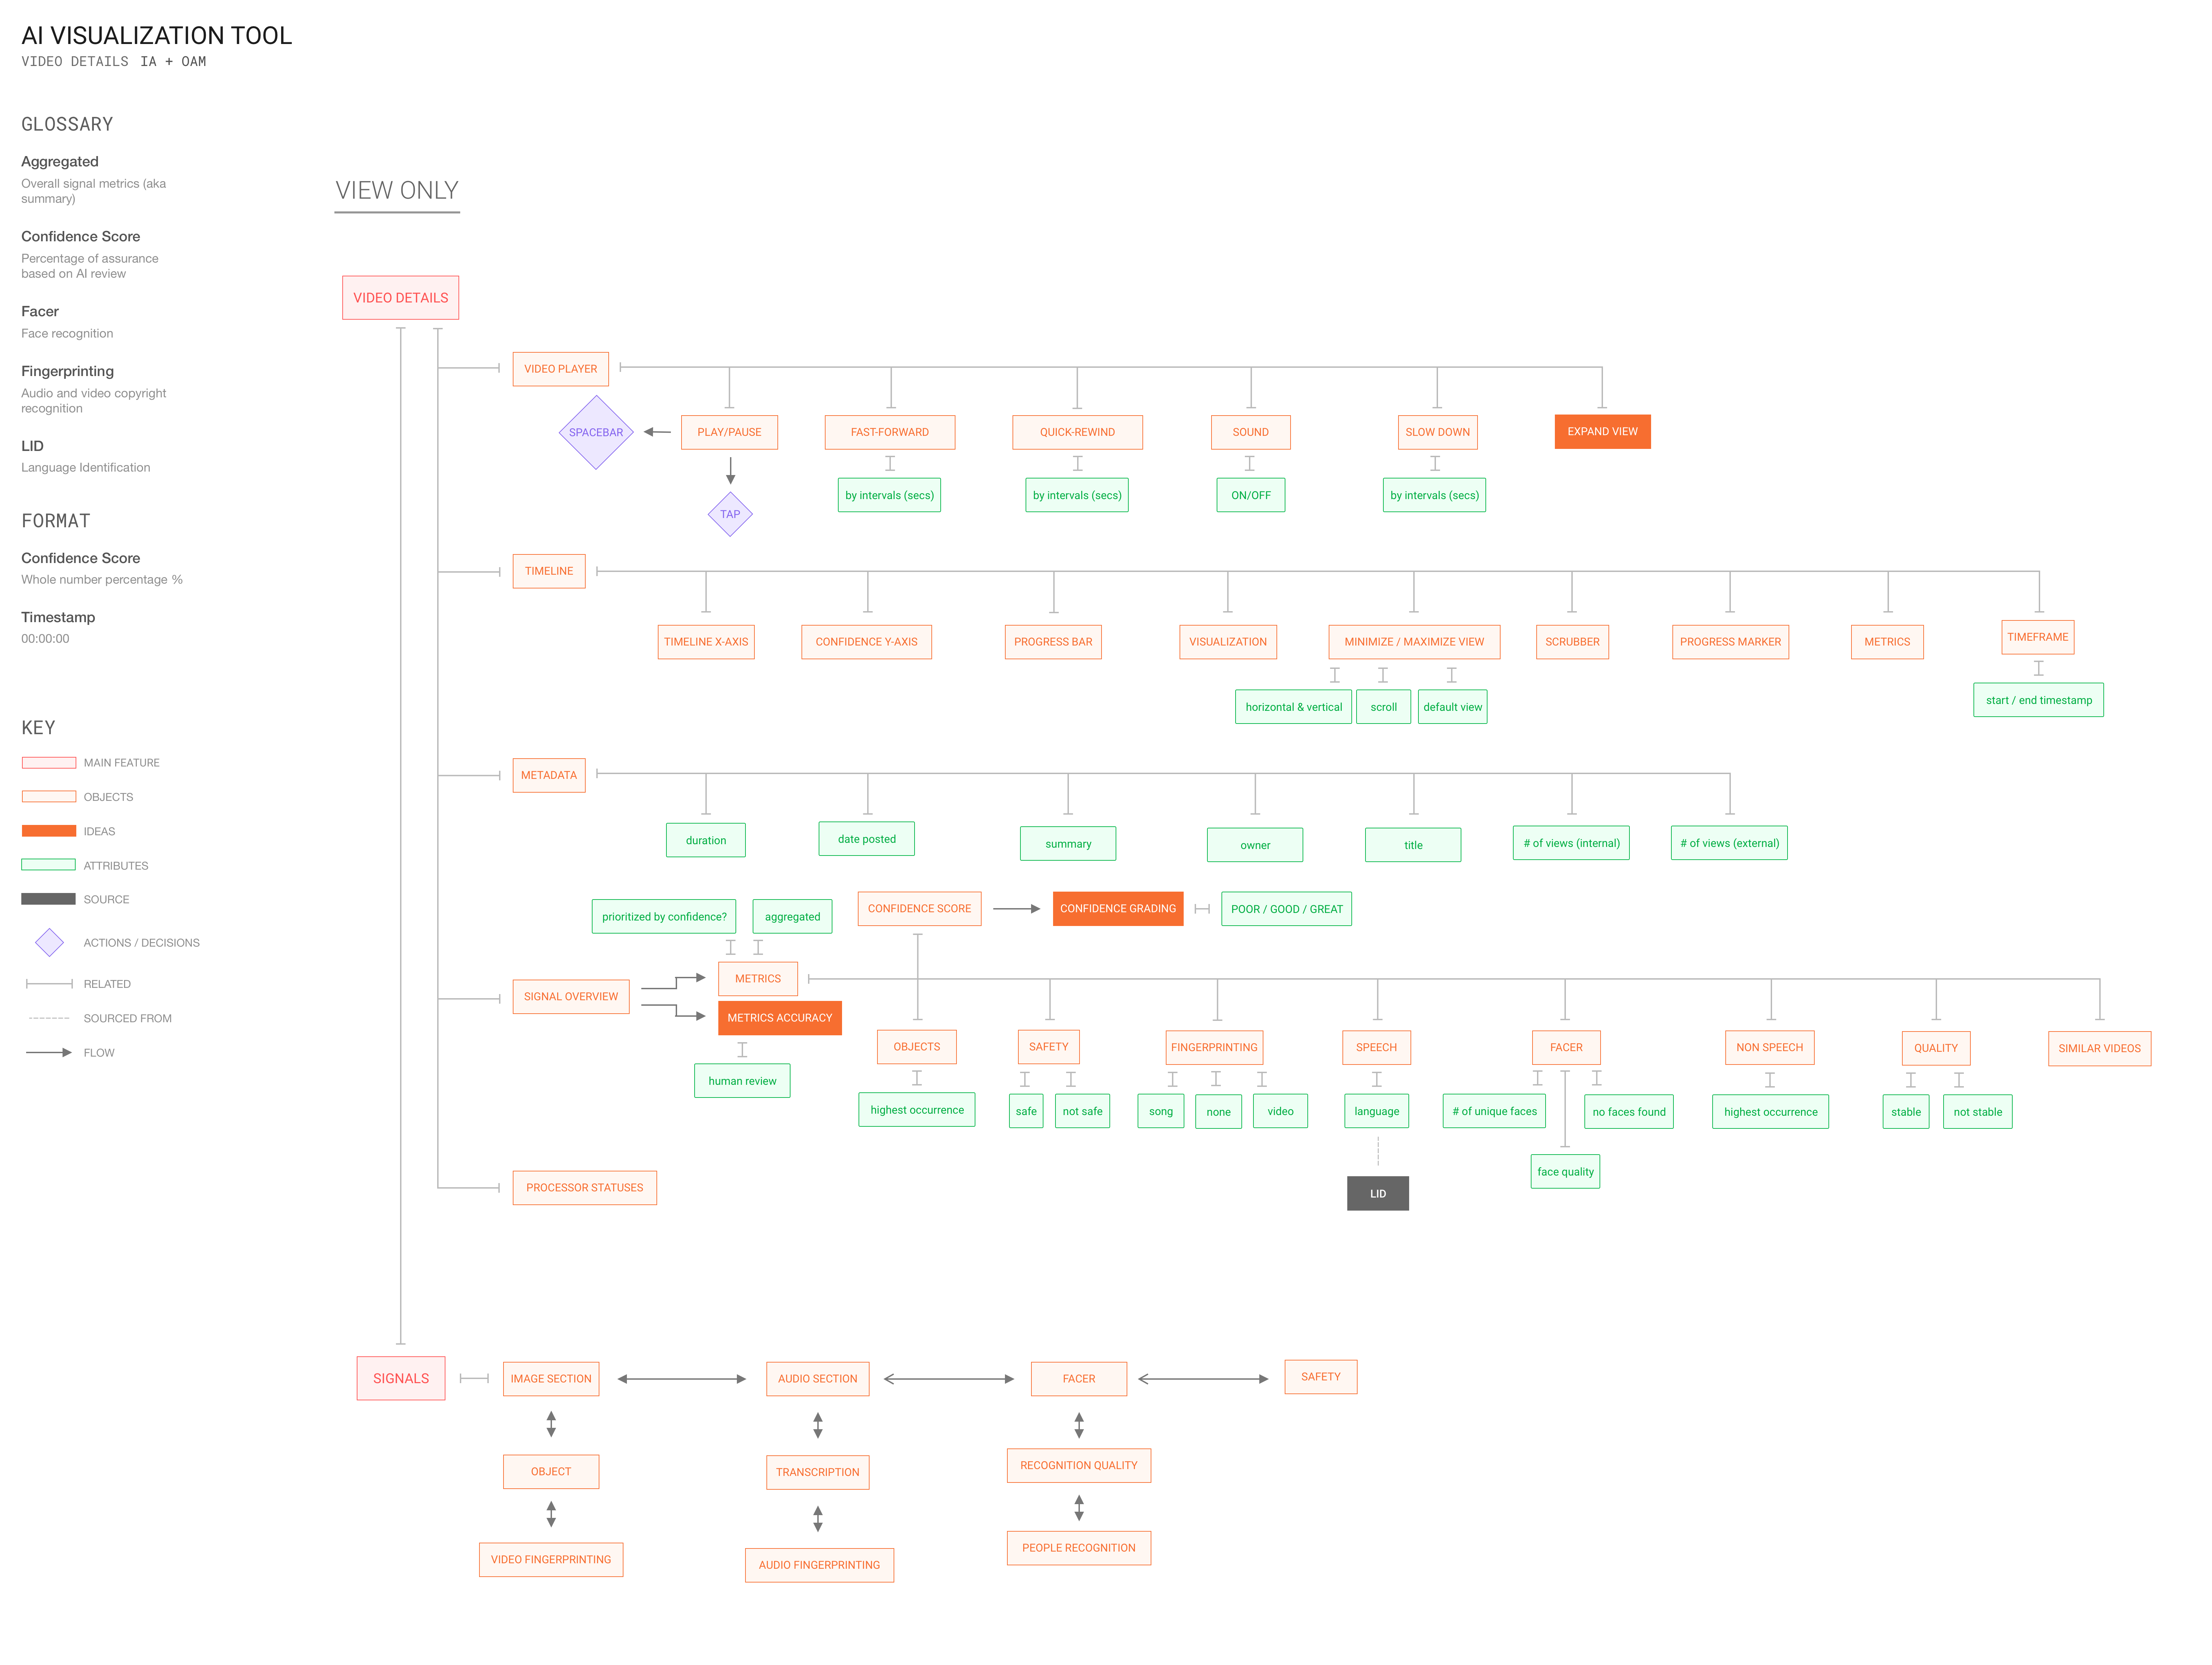
DIAGRAM OUTCOMES
- This diagram shows how the video details screen requires the basics such as video player and timeline, while also needing to show an overview of the signal metrics to give a summary of what signals metrics were captured.
- The bottom portion of the diagram labeled "Signals" is structured based on how data scientists work on different signals from each other and don't need to see different signal outputs together.
- This map also includes a glossary of terms used by data scientists, format of how certain metrics are represented, and a color key guide of all the objects, actions, attributes, and flow diagram components.
- This diagram helped to put all the elements needed for this part of the tool and it structured the information based on how data scientist work.
Transcription Signal Diagram
A hybrid diagram showing both transitions and object-action modeling of a transcription signal view
DIAGRAM OUTCOMES
- Mapping out the structure of the data and all the attributes of every object helped to organize all the parts of this complex tool, leaving nothing missed
- This diagram received positive feedback from other designers who had tried to solve this problem in past iterations and found the amount of data and components challenging to design for
- Including the "source" showing where data was coming from helped me develop a deeper understanding of what services and technologies the data scientists worked with
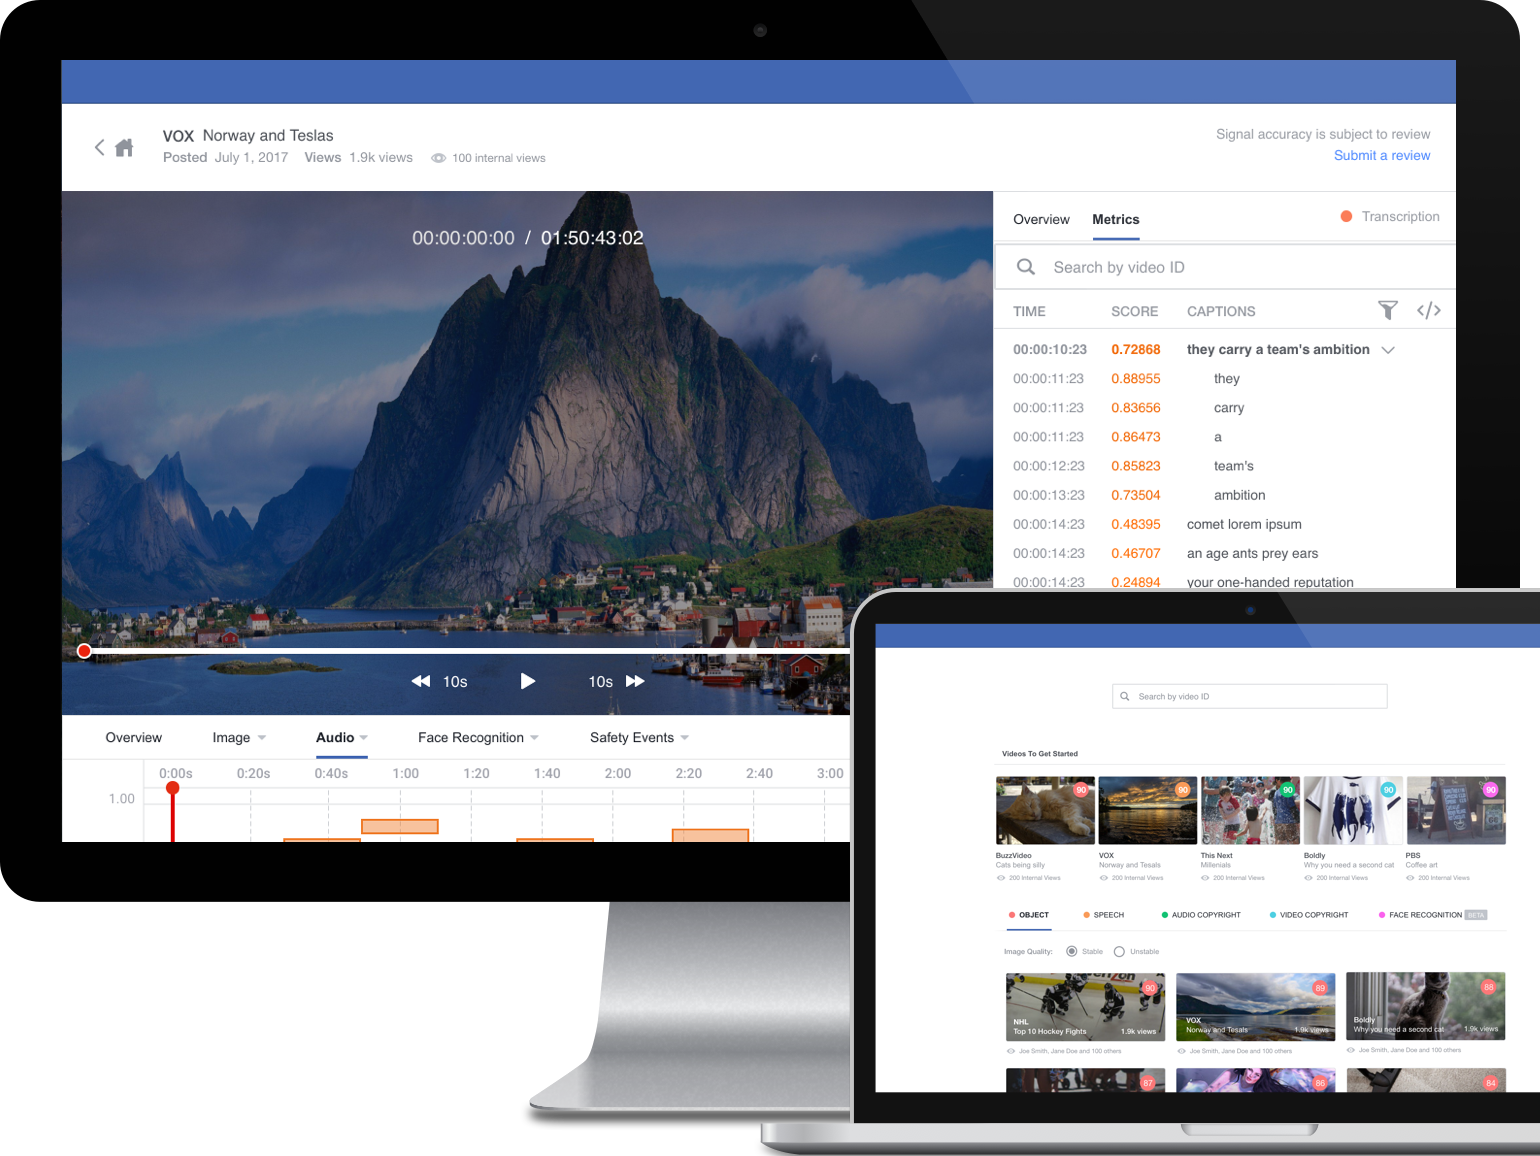
AI Visualization Tool
This click-through prototype shows how transcription signal data is visualized in the tool
PROJECT OUTCOMES
- Developed a deeper understanding of artificial neural networks and cross-functional tasks of internal AI technologies such as transcription, language, voice command, speech-to-text, behavioral analysis, fingerprinting, and object and facial recognition
- This tool received positive feedback from data scientists, designers, and engineers, as they could all view how a signal was performing throughout a video in a visual manner rather than as a plain-text output
